Liquid Alternatives—Why Now?
2022 left investors scrambling to preserve capital and find alternative sources of return. Both equities and bonds across the globe suffered in the high inflation and rising interest rate environment. The S&P 500 Index ended the year at -18.1%, the MSCI EAFE Index ended at -14.5%, and the Bloomberg Aggregate Bond (US Agg) Index ended at -13.0%.

Key takeaways
- The broad downturn across stock and bond markets in 2022 generated considerable interest in liquid alternative investments.
- Liquid alternative strategies, including long/short equities and alternative risk premia, have provided strong performance and diversification to equity and bond portfolios.
- When added to a traditional 60/40 portfolio, liquid alternatives have historically improved returns, reduced volatility and drawdowns, and improved Sharpe ratios.
The broad downturn across stock and bond markets in 2022 generated considerable interest in liquid alternative investments. In this article, we focus on long/short equity and alternative risk premia as our representative liquid alternatives strategies. Historically, they have provided strong performance, with added diversification to a core equity and bond portfolio. Many investors are now wondering whether this is the right time to add liquid alternatives to their own portfolios. Overall, long-short equity, alternative risk premia, and other liquid alternatives strategies:
- Are designed to be much less sensitive to equity and bond market gyrations
- Outperformed a 60/40 stock/bond portfolio[1] over the past one and three years on a trailing-returns basis
- Improved portfolio returns and volatility when added to a 60/40 stock/bond portfolio[2] (see Figure 3)
A challenging macroeconomic environment
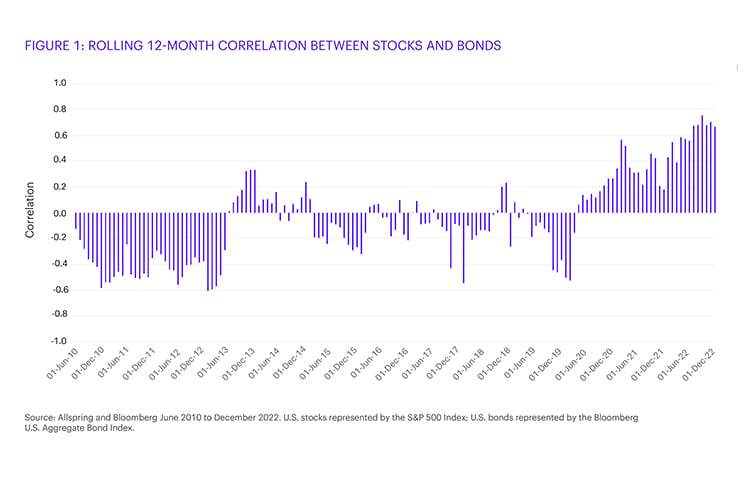
Today’s macroeconomic picture looks very different than it did from 2009 through 2021. Surprisingly resilient inflation, coupled with the abrupt shift from extremely accommodative monetary policy to a much more restrictive monetary stance, could mean a higher-for-longer state for both inflation and interest rates. Greater interest rate uncertainty has clouded the economic growth picture. This is important for investors because concerns about inflation and interest rates tend to drive stock-bond correlations higher.[3] We saw this in 2022, when both stock and bond markets recorded significant losses.
Figure 1 illustrates an abrupt change in the correlation between stocks and bonds as it turned decidedly positive at the beginning of the pandemic. This a stark difference from the previous 10 years. As inflation picked up in 2021 and into 2022, correlations increased further, hitting new highs and averaging 0.6 to 0.8 for most of 2022. Higher stock-bond correlations highlight the need for liquid, diversifying sources of return.

Seeking diversification, liquidity, and strong performance
With higher correlations between stock and bond returns and an uncertain outlook for these major asset classes, investors may seek to improve portfolio efficiency with liquid alternatives such as long-short equity (referred to as an equity hedge) and more macro-oriented alternative risk premia (ARP) strategies.[4] We see three key portfolio characteristics that liquid alternatives bring to a portfolio: diversification, liquidity, and performance.
1. Diversification: The long-short construction of liquid alternatives seeks:
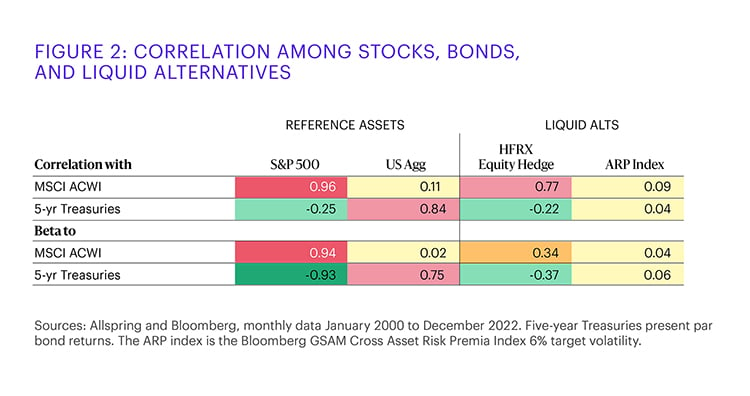
- Reduced correlation with equity and bond returns
- Significantly lower sensitivity to equity and bond market swings
Figure 2 demonstrates how liquid alternatives stacked up against stocks and bonds in terms of correlation and sensitivity to the broad market.

2. Liquidity: Liquid alternatives have scored well on two key aspects of liquidity: liquid asset holdings and liquid vehicles to access these investments. These two features have become increasingly important, as market liquidity has dropped along with central bank tightening and as portfolio liquidity has become more important, with illiquid assets making up a larger portion of many portfolios.
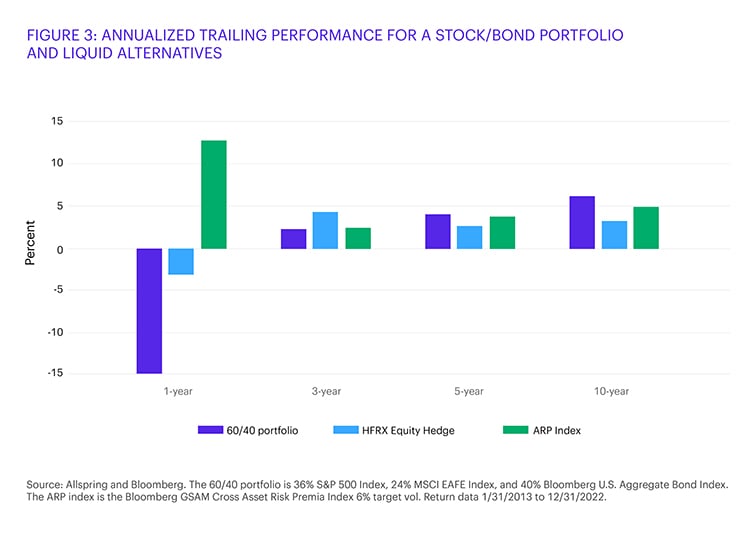
3. Performance: Figure 3 plots the 1-, 3-, 5-, and 10-year trailing annualized performance for a benchmark 60/40 stock/bond portfolio, a long-short equity index, and an alternative risk premia index.
- Both equities and bonds struggled in 2022, but long-short equity (hedged equity) fared much better and ARP excelled.
- Over the trailing 1- and 3-year periods, liquid alternatives outperformed the 60/40 stock/bond portfolio.
- Over longer periods, liquid alternatives have done a reasonable job of keeping pace with a 60/40 portfolio and at two-thirds the volatility.

Positioning liquid alternatives in a portfolio
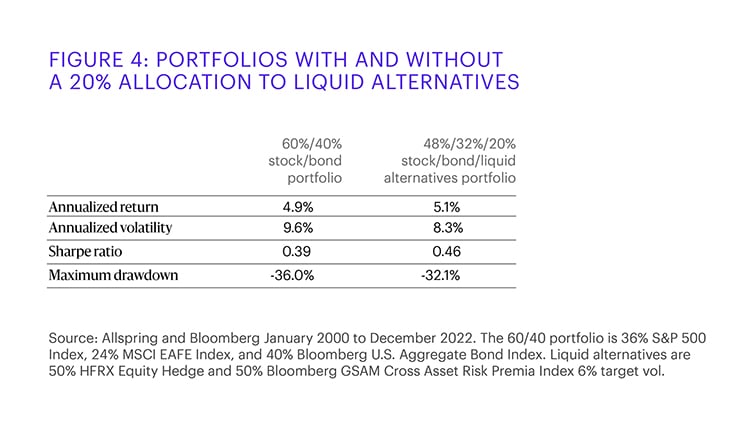
Liquid alternatives have the potential to offer attractive diversification, liquidity, and performance. How did they contribute within a portfolio context? Figure 4 shows that, over the past 23 years, adding 20% liquid alternatives to a 60/40 stock/bond portfolio improved performance, reduced volatility, improved the Sharpe ratio, and reduced the maximum drawdown.

Why now or why not?
Many investors are looking for ways to reduce equity and bond exposure in their portfolios and add a diversifying return source that does not compromise liquidity. Liquid alternatives delivered better performance over one and three years than a 60/40 stock/bond portfolio. When added to a 60/40 portfolio, they improved returns, reduced volatility and drawdowns, and improved the Sharpe ratio. Because liquid alternatives are considered cash-plus investments, they can also capitalize on the 4.5% tailwind they have not had in the past 15 years. So perhaps the question investors should be asking is not why now, but why not?
[1]. The 60/40 benchmark portfolio is 36% S&P 500 Index, 24% MSCI EAFE Index, and 40% Bloomberg U.S. Aggregate Bond Index.
[2]. Annualized returns, January 2000 to December 2022.
[3]. Brian Jacobsen and Matthias Scheiber. “When to Diversify Differently.” The Journal of Portfolio Management Multi-Asset Special Issue 48 no. 4 (2022).
[4]. ARP strategies generally look to capture returns to factors such as value, momentum, and carry across equities, bonds, currencies, and commodities.
Diversification does not ensure or guarantee better performance and cannot eliminate the risk of investment losses.
Sharpe ratio measures the potential reward offered by a mutual fund relative to its risk level. The ratio uses a fund’s standard deviation and its excess return to determine reward per unit of risk. The higher the Sharpe ratio, the better the fund’s historical risk-adjusted performance. Past performance is no guarantee of future results.
Source: MSCI. MSCI makes no express or implied warranties or representations and shall have no liability whatsoever with respect to any MSCI data contained herein. The MSCI data may not be further redistributed or used as a basis for other indexes or any securities or financial products. This report is not approved, reviewed, or produced by MSCI.
*Standard & Poor’s 500 Index (S&P 500 Index): The S&P 500 Index consists of 500 stocks chosen for market size, liquidity, and industry group representation. It is a market-value-weighted index with each stock’s weight in the index proportionate to its market value. You cannot invest directly in an index.
*MSCI EAFE Index: The MSCI EAFE Index is an equity index which captures large and mid cap representation across 21 Developed Markets countries around the world, excluding the US and Canada. With 918 constituents, the index covers approximately 85% of the free float adjusted market capitalization in each country.
*Bloomberg U.S. Aggregate Bond Index: The Bloomberg U.S. Aggregate Bond Index is a broad-based benchmark that measures the investment-grade, U.S.-dollar-denominated, fixed-rate taxable bond market, including Treasuries, government-related and corporate securities, mortgage-backed securities (agency fixed-rate and hybrid adjustable-rate mortgage pass-throughs), asset-backed securities, and commercial mortgage-backed securities. You cannot invest directly in an index.