Follow the Insight
Riding the Curve
Riding the curve allows fixed income investors to generate diversified returns across the yield curve and up and down the rating spectrum. Over time, higher income has typically resulted in better risk-adjusted returns for fixed income investors.

Don’t wait for fixed income markets to be "just right." Look beyond cash investments to start "Riding the Curve."
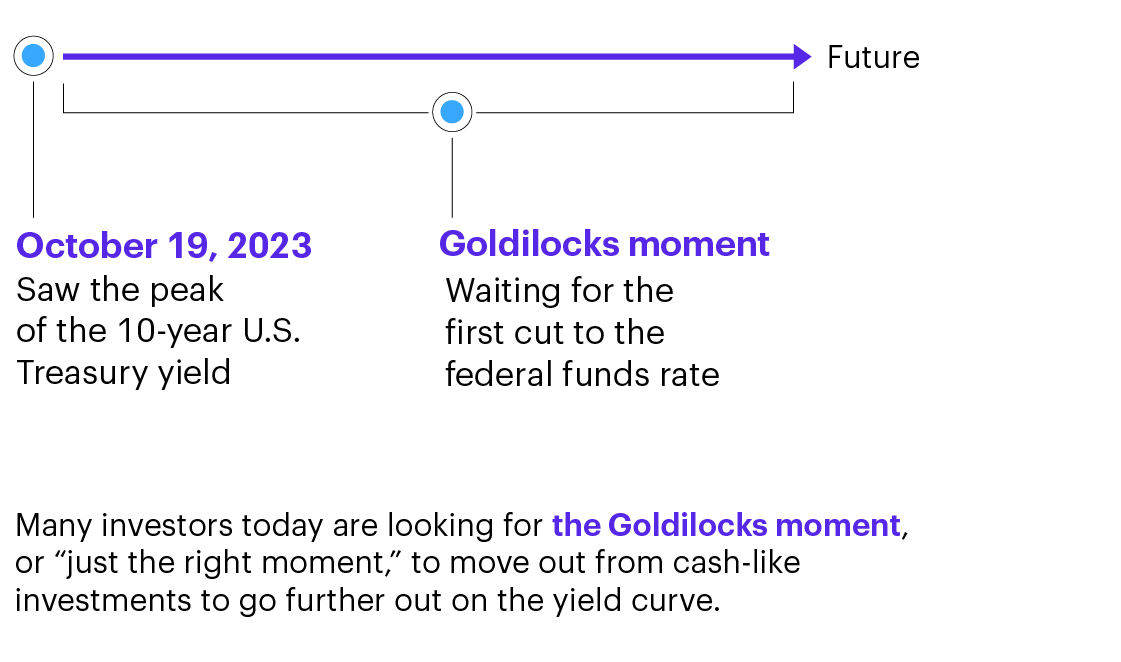
Where we are today
Timing the market can be difficult
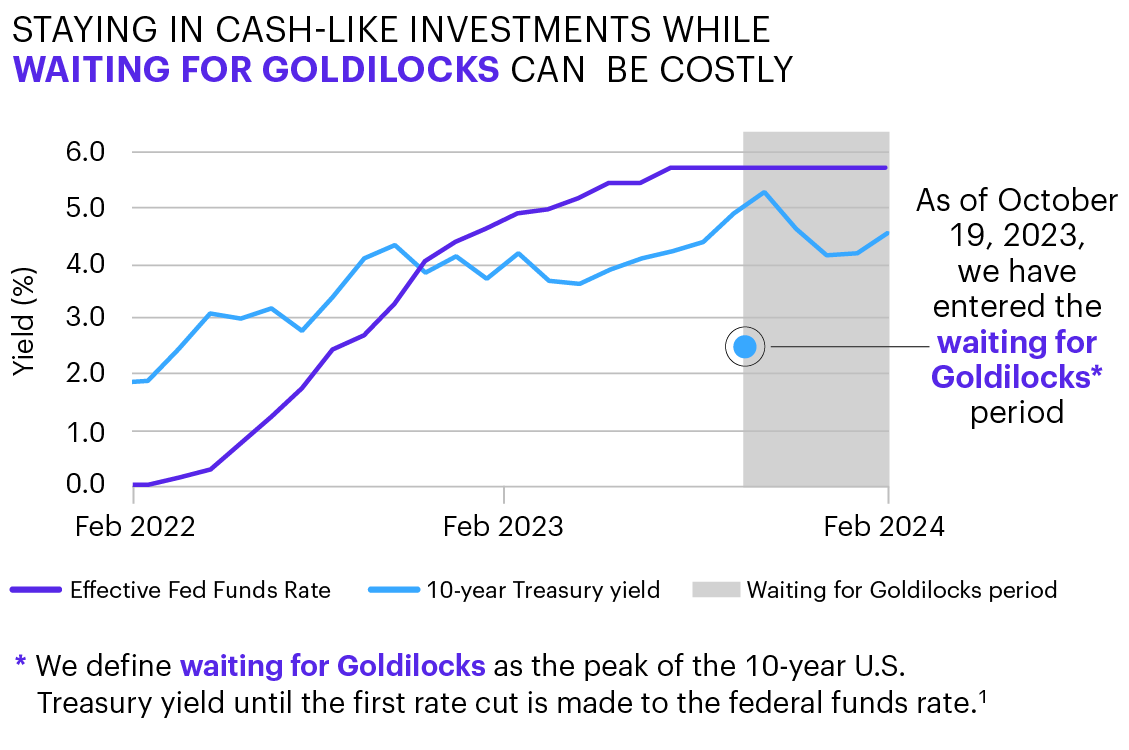
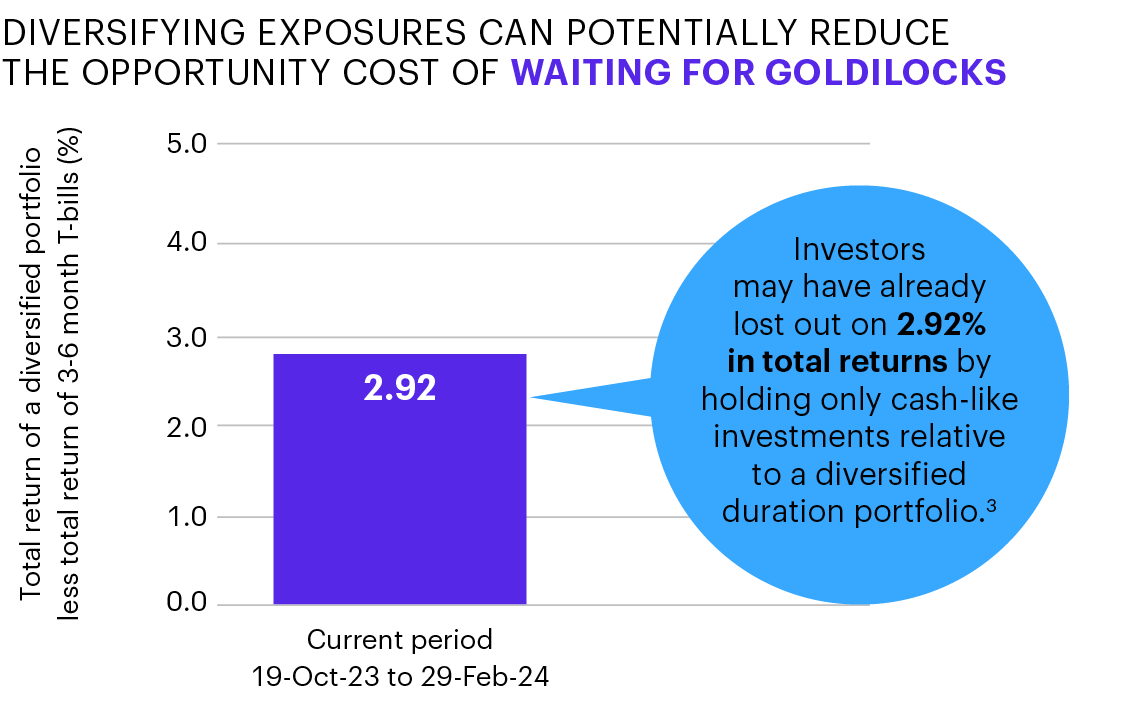
The opportunity cost of waiting for Goldilocks

Don't wait for the Goldilocks moment
Follow our insights

Podcast
Still T-bill and Chill?Jeff Weaver, CFA, head of Allspring’s Global Liquidity Solutions team, and George Bory, CFA, chief investment strategist for Allspring Fixed Income, discuss recent Fed (U.S. Federal Reserve) activity, new money fund liquidity requirements, and allocating investments at the front end of the curve.

Amidst a backdrop of diverging growth and inflation trends driving central bank policy, three strategies for global investors remain as relevant today as they were in the beginning of the year.
George Bory, Chief Investment Strategist for Fixed Income, interviews Noah Wise, Senior Portfolio Manager for the Plus Fixed Income team. The pair discuss how the Fed may react to stickier inflation, a potential market impact of the impending U.S. election, and benefits of diversifying your fixed income portfolio.

Janet Rilling, head of Allspring’s Plus Fixed Income Team, was named by Morningstar again in 2023 as one of the top female portfolio managers in the U.S.

The municipal bond market is highly fragmented and inefficient, often making it difficult for individual investors to effectively transact. Learn how institutions can offer a better experience for investors who leverage their capabilities.

For bond investors, the “Goldilocks moment” has arrived. We see this as an opportunity to diversify duration or “ride the curve.”

Recent higher bond market volatility has driven increased dispersion across sectors/securities, creating opportunities for prudent security selection that can enhance returns within high-quality fixed income portfolios.

Recent performance in the fixed income markets has brought tax-loss harvesting into sharper focus. Read why harvesting losses now may help investors mitigate tax erosion and enhance overall wealth.
Sources: 1. Allspring and Bloomberg Finance L.P., as of 29-Dec-23. Waiting for Goldilocks = peak of 10-year U.S. Treasury yield until first cut to the fed funds rate. Goldilocks periods = first cut to the fed funds rate until the last cut for the time period. Peak of the 10-year U.S. Treasury yield shown above is at 4.98% on 19-Oct-23. 2. Allspring and Bloomberg Finance L.P., as of 29-Dec-23. Waiting for Goldilocks = peak of 10-year U.S. Treasury yield until first cut to the fed funds rate. Goldilocks periods = first cut to the fed funds rate until the last cut for the time period. Peak of the 10-year U.S. Treasury yield shown above is at 4.98% on 19-Oct-23. 3. Bloomberg Finance L.P. and ICE BofA, as of 29-Dec-23. 3- to 6-month T-bills = Bloomberg U.S. 3-6 Month Treasury Bill Index (LD21TRUU Index), diversified portfolio represents 25% in each of the four indexes: Bloomberg U.S. 3–6 Month Treasury Bill Index (LD21TRUU Index), Bloomberg U.S. 1–3 Year Gov/Credit Index (LGC3TRUU Index), Bloomberg U.S. Aggregate Bond Index (LBUSTRUU Index), and ICE BofA Current 10-Year Treasury Index (GA10 Index). Transitionary period of monetary policy = peak of 10-year U.S. Treasury yield until the last cut for the time period. Current period = 19-Oct-23 to 29-Dec-23. Diversification does not ensure or guarantee better performance and cannot eliminate the risk of investment losses. Past performance does not guarantee future results.
The Morningstar Rating™ for funds, or star rating, is calculated for managed products (including mutual funds, variable annuity and variable life subaccounts, exchange-traded funds, closed-end funds, and separate accounts) with at least a three-year history. Exchange-traded funds and open-ended mutual funds are considered a single population for comparative purposes. It is calculated based on a Morningstar risk-adjusted return measure that accounts for variation in a managed product's monthly excess performance, placing more emphasis on downward variations and rewarding consistent performance. The Morningstar Rating does not include any adjustment for sales loads. The top 10% of products in each product category receive 5 stars, the next 22.5% receive 4 stars, the next 35% receive 3 stars, the next 22.5% receive 2 stars, and the bottom 10% receive 1 star. The Overall Morningstar Rating for a managed product is derived from a weighted average of the performance figures associated with its 3-, 5-, and 10-year (if applicable) Morningstar Rating metrics. The weights are: 100% 3-year rating for 36-59 months of total returns, 60% 5-year rating/40% 3-year rating for 60-119 months of total returns, and 50% 10-year rating/30% 5-year rating/20% 3-year rating for 120 or more months of total returns. While the 10-year overall star rating formula seems to give the most weight to the 10-year period, the most recent 3-year period actually has the greatest impact because it is included in all three rating periods. The Morningstar Rating is for this class only; other classes may have different performance characteristics. Past performance is no guarantee of future results.
Some of Morningstar’s proprietary calculations, including the Morningstar Rating™, are not customarily calculated based on adjusted historical returns. However, for new share classes/channels, Morningstar may calculate an extended-performance Morningstar Rating. The extended performance is calculated by adjusting the historical total returns of the oldest share class of a fund to reflect the fee structure of the younger share class/channel, attaching this data to the younger share class’s performance record, and then compounding the adjusted plus actual monthly returns into the extended-performance Morningstar risk-adjusted return for the 3-, 5-, and 10-year time periods. The Morningstar risk-adjusted returns are used to determine the extended-performance Morningstar Rating. The extended-performance Morningstar Rating for this fund does not affect the retail fund data published by Morningstar, as the bell curve distribution on which the ratings are based includes only funds with actual returns. The Overall Morningstar Rating for multi-share funds is based on actual performance only or extended performance only. Once the share class turns three years old, the Overall Morningstar Rating will be based on actual ratings only. The Overall Morningstar Rating for multi-share variable annuities is based on a weighted average of any ratings that are available.
While the inclusion of pre-inception data in the form of extended performance can provide valuable insight into the probable long-term behavior of newer share classes of a fund, investors should be aware that an adjusted historical return can provide only an approximation of that behavior. For example, the fee structures of a retail share class will vary from that of an institutional share class, as retail shares tend to have higher operating expenses and sales charges. These adjusted historical returns are not actual returns. The underlying investments in the share classes used to calculate the pre-performance string likely will vary from the underlying investments held in the fund after inception. Calculation methodologies used by Morningstar may differ from those applied by other entities, including the fund itself.
© 2024 Morningstar. All rights reserved. The information contained herein is proprietary to Morningstar and/or its content providers; may not be copied or distributed; and is not warranted to be accurate, complete, or timely. Neither Morningstar nor its content providers are responsible for any damages or losses arising from any use of this information.